
Claude for Climate | Episode 2 of 7
Why Scope 3 data keeps failing companies, and a practical six-step workflow for using Claude to fix it.
Rob Aldrich · Technology & Sustainability Executive · Sydney, Australia
robaldrich.com · LinkedIn · @googlenut
In Episode 1, I made the case that most companies are reporting on sustainability before they have genuinely measured it. The benchmark comes first. Everything else follows from that.
This episode is about why that benchmark is so hard to get right, and why Scope 3 in particular is where most efforts break down.
The 90% problem
Scope 1 and Scope 2 emissions are things you can, in principle, count. Your direct fuel combustion, your purchased electricity, your company-operated vehicles. Difficult to do well at scale, but the data exists somewhere in your own organisation.
Scope 3 is different. It covers the emissions generated across your entire value chain: everything upstream from your operations and everything downstream from your products and services. Business travel, employee commuting, purchased goods and services, waste disposal, use of sold products, end-of-life treatment of those products.
McKinsey estimates that Scope 3 represents around 90% of total emissions for most industries. A 2024 joint analysis by CDP and Boston Consulting Group found that corporate supply chain emissions are, on average, 26 times greater than their direct operational emissions. For companies with complex supply chains, the figure is often higher.
This is not a rounding error. The emissions that matter most are precisely the ones hardest to collect.
(CDP/BCG, 2024)
(CDP, 2024)

Why the data keeps breaking
I’ve seen limited progress over the last 25 years of working on this data. The 1.8% reduction in global data center energy usage that resulted, in part, from my work on EnergyWise and at the Green Grid between 2010-2020, was completely negated by bitcoin mining within 2 years. The pattern is consistent regardless of industry or company size and our attention to these existential challenges has been hijacked in popular media.
The Scope 3 data problem is not primarily a technology problem. It is a fragmentation problem.
A company with 500 suppliers will receive emissions data in 500 different formats, using at least four or five different methodologies, referencing emission factors from different years and different national databases. Some suppliers report in CO2e. Others report in energy consumed, leaving the conversion to the receiving company. Others report nothing at all and require estimation from spend data.
Then there is the methodology gap. The GHG Protocol Corporate Value Chain Standard provides the framework, but it leaves substantial room for interpretation at the category level. Two suppliers in the same industry reporting under the same framework can produce numbers that are not directly comparable without additional reconciliation work.
According to CDP’s 2024 Strengthening the Chain report, only 15% of companies target their value chains in their emissions reduction efforts, and fewer than one in four include supply chain climate risks in their formal risk management processes. The data collection burden is a significant reason for that gap: most sustainability teams are spending the majority of their available capacity assembling and reconciling numbers rather than acting on them.
That mirrors what I experienced at SafetyCulture, where I served as interim Chief AI Officer. Not a large company by global standards, but even at our scale the Scope 3 data assembly process for annual reporting was manual, inconsistent year to year, and dependent on a small number of people who held the institutional knowledge of where each number came from.
Where Claude enters the picture
Claude’s practical strength is reading messy, inconsistent documents, finding the signal in them, and producing structured output. The Scope 3 data problem is almost entirely that kind of work.
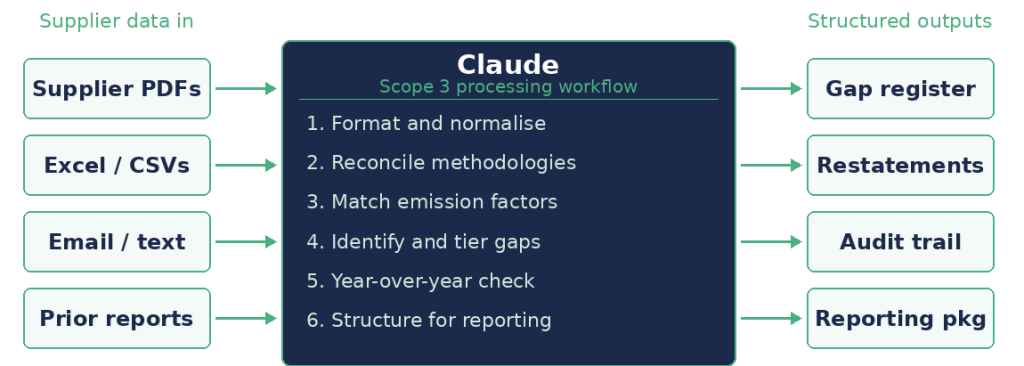
Here is the workflow I have been using and refining over the past several months. I am not presenting this as the only way to do it. I am presenting it as what has worked in practice.
Step 1
Format normalisation
Supplier emissions data arrives in PDFs, Excel files, CSVs, and unstructured email text. Before you can do anything useful with it, you need it in a consistent structure. Claude reads incoming supplier documents and extracts reported figures, methodology references, baseline years, and emission factor sources into a standardised schema. This alone reduces hours of manual extraction work per supplier batch.
Step 2
Methodology reconciliation
Not all Scope 3 reporting uses the same methodology, and the differences matter. Claude can identify which approach each supplier used (spend-based estimation, average data method, supplier-specific method, hybrid approaches) and flag where methodologies are inconsistent across similar suppliers. This does not solve the inconsistency, but it surfaces it reliably and early, before it propagates through the final report.
Step 3
Emission factor matching
DEFRA updates its UK conversion factors every year. The IEA updates country grid emissions intensities with each annual release. A supplier reporting 2022 electricity consumption using 2019 emission factors has a material error in their reported figure, and it is common. Claude can cross-reference reported emission factors against published databases by year and region, flag where a supplier appears to be using stale factors, and calculate the likely magnitude of the resulting error. It cannot replace a human review of the final factors applied, but it can flag the discrepancies for review rather than letting them pass through silently.
Step 4
Gap identification and estimation tiering
Not every Scope 3 category will have primary data. The GHG Protocol allows for spend-based estimation as a fallback, but spend-based estimates carry a much wider uncertainty range than supplier-specific data. You need to know which categories are estimated, how confident you should be in those estimates, and where to prioritise primary data collection. Claude builds a tiered gap register: categories with primary data, categories estimated from spend, categories missing entirely, and a confidence rating for each. For a company that has never done this systematically, the gap register alone is a significant deliverable.
Step 5
Year-over-year comparability check
Emissions figures that appear to show a reduction sometimes reflect a methodology change rather than an actual emissions reduction. If you added a new emission factor source in year two, or changed how you account for employee commuting, the comparison to year one is not valid without a restatement. Claude reads prior-year reports alongside current-year data and flags where like-for-like comparison is broken. It then drafts the restatement notes that your report will need to accurately represent what changed and why.
Step 6
Structured output for reporting
The final output is a structured dataset with provenance notes for each figure: what data it came from, what methodology was applied, what emission factor was used and from which source, what the confidence level is, and what caveats apply. This is the version that goes to your external auditor or your ESG reporting platform. The structured output also becomes the audit trail that regulators are increasingly requiring. Under CSRD, you need to be able to demonstrate the basis for every material figure. A provenance-annotated dataset is that demonstration.

What Claude cannot do
This is the part most AI writeups skip. I will not.
Claude does not know what year it is being used. If you ask it to apply the current DEFRA emission factors, it will apply the factors from its training data, which may be a year or more out of date. You need to supply the current factors explicitly as context, or it will use stale ones without flagging the issue.
Claude hallucinates. Not often, and less on structured extraction tasks than on generative ones, but it happens. Any figure Claude extracts from a supplier document should be verified against the source. I treat Claude as a first pass, not a final answer.
Claude cannot verify. It can flag that a supplier’s reported figure appears inconsistent with their industry peers, but it cannot audit the supplier’s underlying records or confirm that the reported figure represents what the supplier says it represents. Verification still requires human judgment and, for material categories, independent assurance.
Claude does not understand your specific context unless you tell it. Supply chain structures, contractual relationships, geographic operations, boundary decisions your team made three years ago and never documented: none of that is available to the model unless you provide it. The quality of the output is directly proportional to the quality of the context you supply.
These are real limitations. They do not make the tool useless. They make it a tool that requires informed use, which is true of every other instrument in the sustainability practitioner’s toolkit.
What this changes
The Scope 3 data problem is not going to be solved by any AI tool. The fragmentation is structural, the incentives for suppliers to provide consistent data are still weak, and the regulatory frameworks are still inconsistent across jurisdictions.
What Claude changes is the unit economics of the process. The hours required to ingest, normalise, and QA a batch of supplier data drop significantly. The consistency of the output improves. The gap register that used to require a week of analyst time can be produced in a morning.
That time shifts to the reduction work and the supplier relationship management. That is the subject of Episode 3.
Next in the series
Episode 3: The Supplier Engagement Problem
Supplier response rates for Scope 3 data requests average around 30 to 40 percent. The data that comes back is often incomplete. How do you improve both? That is where the quality of your Scope 3 baseline is actually determined.
Rob Aldrich is a technology and sustainability executive with 25 years of experience at the intersection of enterprise technology, AI, and sustainability. He is the co-creator of Cisco EnergyWise, former Global Sustainable Buildings Lead at Amazon Web Services, and former interim Chief AI Officer at SafetyCulture, where he drove 84% AI tool adoption across 221 engineers. He is the author of IP-Enabled Energy Management (Wiley/IEEE Press) and has conducted sustainability audits across more than 70 data centres worldwide.
robaldrich.com · LinkedIn · @googlenut
Sources
- GHG Protocol Corporate Value Chain (Scope 3) Accounting and Reporting Standard, World Resources Institute / WBCSD
- GHG Protocol Corporate Standard, World Resources Institute / WBCSD
- McKinsey & Company, “What are Scope 1, 2, and 3 emissions?” (2024)
- CDP & BCG, “Scope 3 Upstream: Big Challenges, Simple Remedies” (2024)
- CDP, “Strengthening the Chain: Sector Insights to Accelerate Sustainable Supply Chain Transformation” (2024)
- UK Government GHG Conversion Factors for Company Reporting (DEFRA/DESNZ), updated annually
- IEA, Greenhouse Gas Emissions from Energy, updated annually
- EU Corporate Sustainability Reporting Directive (CSRD), European Commission
- California SB 253, Climate Corporate Data Accountability Act
- Australian Treasury, Mandatory Climate-related Financial Disclosures