
Claude for Climate | Episode 6 of 7
Five episodes in, we have covered the specific places where corporate climate work breaks down: metric selection, data fragmentation, supplier silence, disclosure opacity, and the gap between OT systems and reporting infrastructure. This episode is about what happens when you stop treating those as separate problems.
The problem with point solutions
Every sustainability team I’ve worked with over the years has the same challenge, phrased in different ways. They have tools. They have consultants. They have dashboards. And yet the work is still mostly manual, the numbers are still mostly uncertain, and the reporting cycle still lands like an emergency every time.
The reason is not that the tools are bad. The reason is that climate work does not break along the lines that software products are built around. A carbon accounting platform handles Scope 1 and 2 well and then stops at the supplier boundary. A procurement tool surfaces Scope 3 spend data but cannot tell you whether the emissions factors are current. A BMS aggregation layer gives you energy by floor, but the translation into emissions, the reconciliation against utility bills, and the flagging of anomalies still happens in a spreadsheet someone maintains manually.
You end up with a collection of point solutions that each solve one slice of the problem, connected by human effort in the middle. That human effort is the bottleneck. It is also where most of the error accumulates.
Claude does not replace any of those tools. What it does is compress the human effort between them.
What the integrated workflow actually looks like
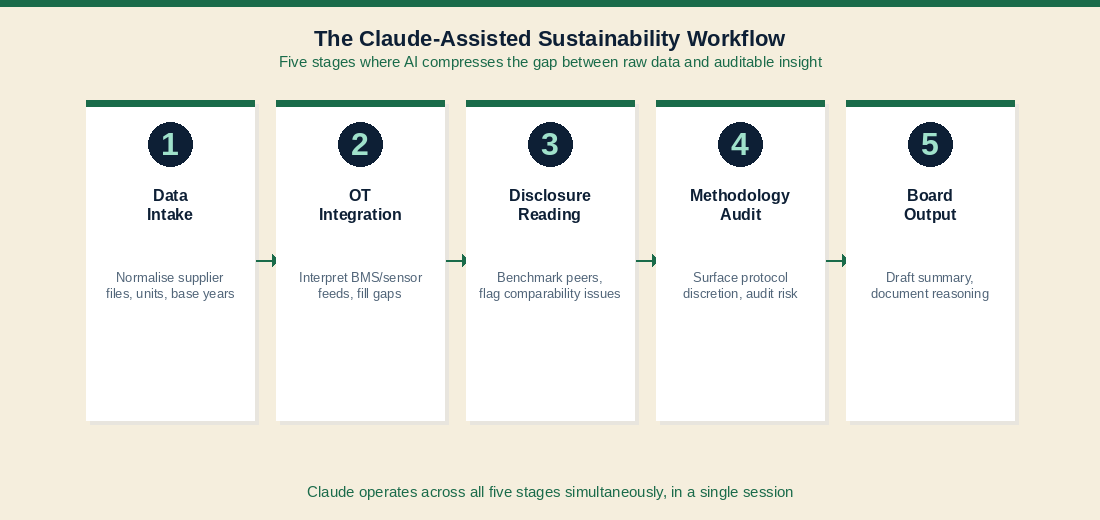
Let me walk through what a Claude-assisted sustainability function looks like end to end, drawing on the specific capabilities we have covered across this series.
Data intake and normalisation
Scope 3 supplier data arrives in inconsistent formats: different units, different boundary assumptions, different base years, different methodologies. As we covered in Episode 2, Claude can normalise this at intake, flag methodological inconsistencies, and produce a gap register before the data ever hits your carbon accounting system. This is not a minor convenience. A sustainability team that previously spent two to four weeks on this step before every reporting cycle can run it in hours, and the output is documented and auditable.
The same logic applies to OT data. As Episode 5 covered, most building energy data sits in BMS systems that predate modern integration standards. Claude can interpret sparse, irregular sensor feeds, infer patterns from incomplete records, and produce structured output that feeds into Scope 1 and 2 calculations. The gap between what your buildings actually produce and what you can report on narrows.
Disclosure reading and benchmarking
Once your internal data is clean, you need to understand it in context. As we covered in Episode 4, Claude can read a competitor’s sustainability disclosure in the same session that you are working with your own numbers. It can identify whether they are reporting on an absolute or intensity basis, flag where boundary assumptions differ from yours, and surface the specific figures that are and are not comparable.
This matters for two reasons. First, your board and investors are comparing you to peers whether you help them or not: you want to do that analysis yourself first. Second, supplier engagement (covered in Episode 3) works better when you can show a supplier exactly how their numbers will appear in your aggregated Scope 3 disclosure, and how that compares to what their peers are reporting.
The methodology layer
Underneath all of this is a problem we covered in Episode 1 that never fully goes away: the methodological choices that determine what you are even measuring. GHG Protocol leaves significant discretion on boundary setting, consolidation approach, and how to handle joint ventures, minority stakes, and leased assets. TCFD and TNFD add scenario requirements on top of that. CSRD adds assurance requirements that change what “documented” means.
Claude does not make these choices for you. What it does is make the choices explicit. When you ask it to assess your Scope 1 boundary treatment, it will surface the specific protocol sections that govern your situation, identify where you have discretion, and flag where your current approach may not match what your auditor or regulator will expect.
Four things Claude is doing in parallel
In a mature deployment, Claude is not a tool you open for specific tasks. It is running across the workflow continuously. Here is what that looks like in practice:
Reading and interpreting
Incoming data, disclosures, regulatory updates, and supplier responses as they arrive. Not storing them: reading them in context and surfacing what matters.
Normalising and reconciling
Data from sources with different formats, units, methodologies, and base years. This is the connective tissue between systems that were never designed to talk to each other.
Flagging and questioning
Anomalies, gaps, and decisions that look inconsistent with prior choices or external benchmarks. A 15% drop in a supplier’s reported Scope 1 intensity deserves a question. Claude will ask it.
Documenting and auditing
The reasoning behind calculations and methodological choices in a form a third-party auditor can follow. This is the piece most companies underinvest in and then scramble on during assurance season.
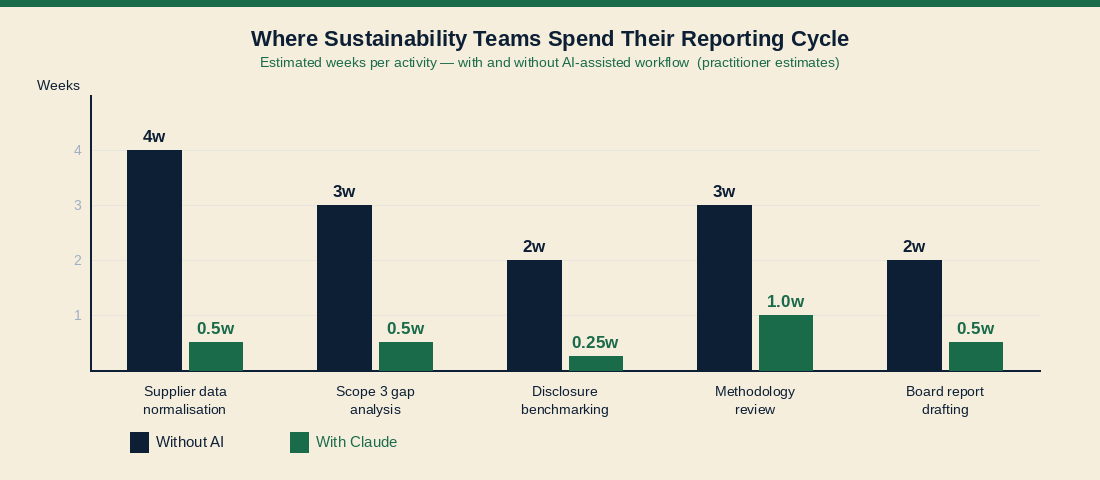
Practitioner estimates. Actual time savings vary by team size, data maturity, and tooling. The pattern, not the precise figure, is the point.
What this does not solve
I want to be direct about the limits, because the pitch for AI in sustainability can get ahead of reality fast.
Claude does not fix incentive problems. If your procurement team is not rewarded for supplier emissions performance, Claude-assisted supplier engagement will still underperform. The organisational alignment has to come first.
Claude does not resolve genuinely contested data. If a supplier reports a figure that is implausible and will not provide supporting documentation, you have a supplier relationship problem, not a technology problem.
Claude does not make regulatory uncertainty go away. CSRD implementation timelines have slipped in multiple jurisdictions. SEC climate disclosure rules are still being litigated. Claude can help you track what is changing and assess your exposure, but it cannot tell you what the final rules will be, because nobody can.
Claude does not replace the judgment of someone who understands your business. The value it creates is in compressing the time between data and insight, and in making the reasoning traceable. The decisions still belong to the people running the function.
The practical prompt patterns for this episode
These four patterns connect the threads from earlier episodes into an integrated workflow.
Prompt pattern 1: Cross-source reconciliation
“I have Scope 3 Category 1 data from three suppliers in the attached files. They are using different base years and different emissions factor sets. Normalise all three to a 2022 base year using the latest DEFRA factors, produce a comparison table, and flag any figures that look anomalous relative to the others or relative to published industry benchmarks for this category.”
Prompt pattern 2: Disclosure gap assessment
“Here is our draft Scope 1, 2, and 3 disclosure for FY2026. Here is the TCFD implementation guidance and our sector’s latest SASB standard. Identify the gaps between our disclosure and what each framework requires, flag where our language is vague in ways that could create audit exposure, and list the three most material things we should fix before external review.”
Prompt pattern 3: Regulatory horizon scan
“We operate in Australia, the UK, and the EU. Summarise the current status of mandatory climate disclosure requirements in each jurisdiction, the expected timelines, what triggers the obligation for a company of our size, and what we would need to have in place to meet the earliest likely deadline.”
Prompt pattern 4: Board-ready summary
“Here is our complete Scope 1, 2, and 3 dataset for FY2026, our prior year comparisons, and our stated 2030 targets. Write a two-page board summary that: states our current performance against targets, explains the three largest drivers of year-on-year change, identifies our two highest-risk areas for the next reporting cycle, and recommends the one investment that would most improve our data quality.”
The shift that matters
There is a version of AI in corporate sustainability that is mostly about saving time on reports. That is real, and it is worth something.
But the more significant shift is epistemic. When the gap between data and insight is weeks or months, most organisations end up making decisions on last year’s numbers, or on estimates that nobody has fully interrogated. When that gap compresses to hours, you can ask harder questions more often. You can stress-test your methodology before the auditor does. You can run the disclosure comparison before the board meeting, not after.
That shift from reactive to analytical is not about the technology. It is about what the technology makes possible for the people running the function. The sustainability leaders who are getting ahead of this are not the ones who have deployed the most tools. They are the ones who have figured out how to use AI to think faster and more rigorously about problems that do not have clean solutions.
Episode 7 is about what this means for the leaders making the investment decisions, and why the window for getting ahead of this is shorter than most people think.