
Claude for Climate | Episode 5 of 7
Scope 1 and 2 are supposed to be the easy numbers: your own fuel, your own electricity. But the data behind them starts in plant rooms, meters and utility bills that were never built to feed a report. This episode is about the distance between the equipment and the ledger.
The easy scopes aren’t easy
Episodes 2 and 3 were about Scope 3, the emissions that sit with other people. The usual assumption is that Scopes 1 and 2 are the solved part. You burn the gas. You buy the electricity. You should know the number.
The record says otherwise. Researchers who analysed a decade of Scope 1 and 2 figures reported to CDP found that about 30% of companies had breakdowns that didn’t match their own totals in at least one category in a given year. These aren’t supplier estimates. They’re a company’s own operations, and the sums don’t reconcile.
It matters because of where the tonnes are. Buildings and construction account for 37% of global operational energy and process-related CO2 emissions. And as Episode 4 showed, the absolute number that moved Amazon’s report was a 34% jump in Scope 2: electricity, in buildings, measured by meters.
Why the data doesn’t speak IP
When I co-created EnergyWise at Cisco, the premise was simple: if a device draws power and sits on the network, you can measure it and manage it. I wrote IP-Enabled Energy Management on that idea. The catch, then and now, is how much of a building’s energy never touches the IP network at all.
Chillers, boilers and generators report to a building management system over BACnet or Modbus, often on a serial loop that predates the corporate network. Sub-meters log to a panel nobody exports. The utility meter belongs to the utility, and its data arrives weeks later as a PDF invoice. Each of those systems does its job. None of them was designed to hand a clean number to a sustainability team.
I’ve written separately about where the lock-in in building systems really sits and how to get data out of them. That’s the engineering problem. This episode is about the reporting problem it creates.
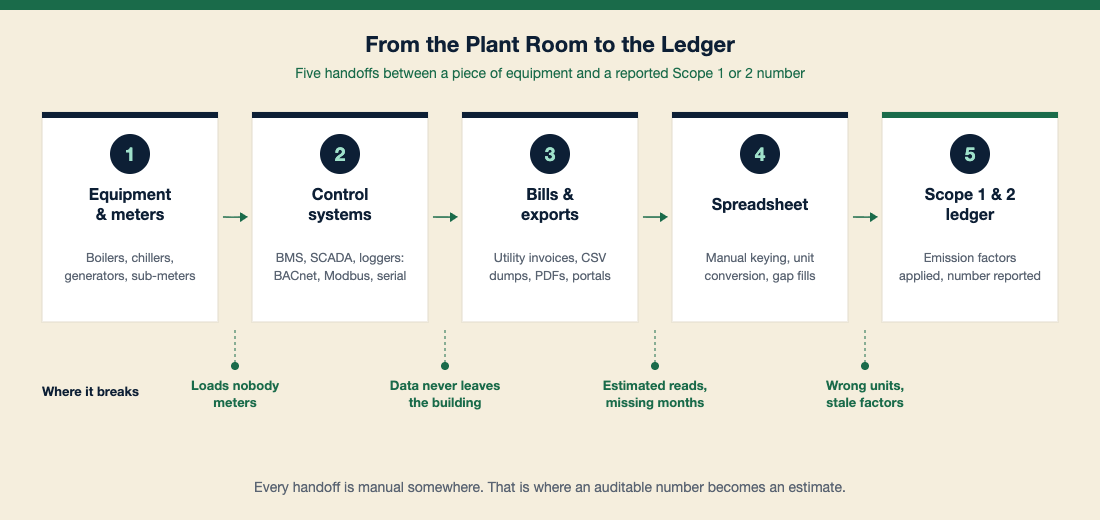
Building the Sustainable Buildings business at AWS, across more than 2,000 buildings, the first job on almost every site was the same: work out what was metered, what was estimated, and what nobody had looked at. The gap between those three is the gap in the inventory.
Where the number goes wrong
The errors in Scope 1 and 2 are rarely dramatic. They’re small, repeated, and invisible once they’re inside a spreadsheet.
Estimated reads treated as actuals
A bill marked “estimated” gets keyed in like any other. The true-up arrives months later, after the inventory has closed.
Units and conversions
kWh, MWh, GJ, therms, litres, cubic metres. One site reported in the wrong unit can move a portfolio total, and nothing in the spreadsheet flags it.
Missing months and missing sites
A lease starts mid-year. An invoice never arrives. The gap gets filled with last year’s figure, and the fill is never labelled.
The wrong emission factor
A grid factor from two years ago, or a national average applied to a state grid. Location-based and market-based figures mixed in the same column.
The last one is about to get harder. The GHG Protocol is rewriting its Scope 2 rules, and the current direction keeps two market-based methods, one of which requires hourly matching, with the final standard expected in late 2028. Nothing is final. But annual totals built from monthly bills won’t be the top tier of evidence for long.
The Claude workflow: from raw operational data to an auditable input
This is the same pattern as Episode 2, pointed at your own operations instead of your suppliers. Claude doesn’t connect to the meter. It works on what comes out: invoices, BMS exports, meter CSVs, fuel delivery dockets.
1. Build the source inventory
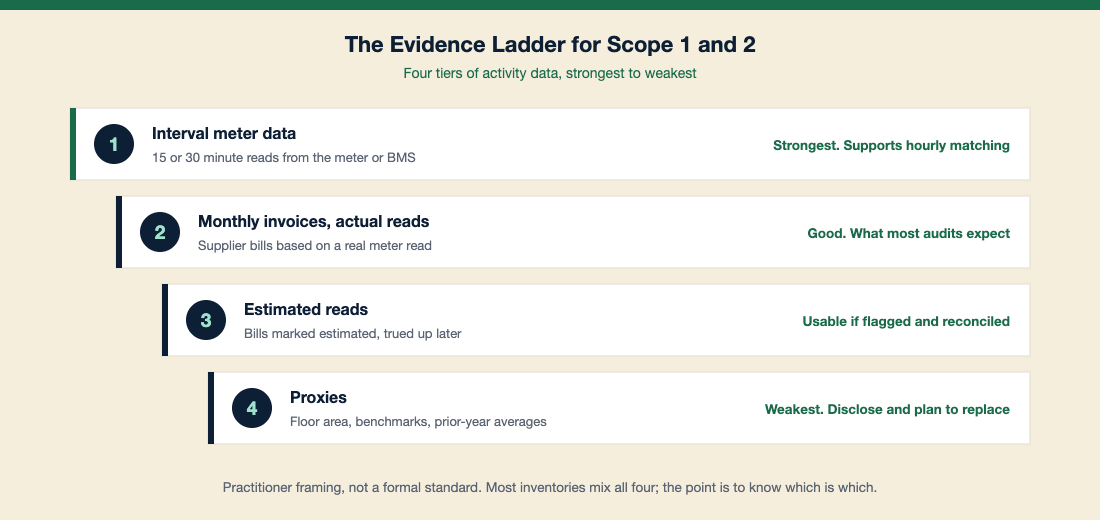
Give Claude the site list and whatever data exists for each one. Ask for a table of every energy source by site, what evidence backs it, and which tier of the ladder that evidence sits on. Most teams have never seen this on one page.
2. Extract and normalise
Invoices in six layouts, a BMS trend export with cryptic point names, a spreadsheet from a landlord. Claude pulls consumption, period, units and the actual-or-estimated flag into one structure, and converts units with the conversion shown.
3. Find the gaps and the outliers
Missing months, overlapping billing periods, a site whose usage doubled with no change in floor area. Claude lists them with the reason each one was flagged. It doesn’t decide which ones are errors. You do.
4. Fill gaps in the open
Where data is missing, Claude can propose an estimate and state the method: prior-year same month, adjacent months, or intensity per square metre from similar sites. Every filled value is labelled as an estimate, with its method, so it can be replaced when the real figure turns up.
5. Match factors and write the provenance log
You supply the current emission factors. Claude applies them, keeps location-based and market-based results separate, and writes the note an assurer will ask for: source document, read type, conversion, factor and vintage for every line.
Prompt patterns for this episode
Prompt pattern 1: Source inventory
“Here is our site list and every energy document we hold for the reporting year. Build a table by site and energy source showing what evidence we have, the period it covers, and whether it is interval data, an actual-read invoice, an estimated read or a proxy. List the sites and months with no evidence at all.”
Prompt pattern 2: Invoice and export normalisation
“Extract consumption, billing period, units and read type from these invoices and meter exports. Convert everything to kWh or GJ and show each conversion. Flag any bill marked estimated, any period that overlaps another, and any figure you were not certain you read correctly.”
Prompt pattern 3: Gap register
“Using the normalised data, list every gap and outlier by site. For each gap, propose an estimation method, state why you chose it, and label the result as an estimate. Do not fill anything silently. Rank the gaps by their likely effect on the total.”
Prompt pattern 4: Assurance note
“Using these emission factors, which I am supplying with their source and year, calculate Scope 1 and Scope 2 by site. Report location-based and market-based Scope 2 separately. Then draft a methodology note listing, for each line, the source document, read type, conversion and factor used.”
The limitations, stated plainly
Claude does not install meters. If a load isn’t measured, no workflow will measure it. Claude can tell you where the blind spots are and what they’re probably worth. Closing them takes capital.
Claude does not know this year’s emission factors unless you give them to it. Grid factors change annually and by region. Supply them, with their source, every time.
Claude can misread a document. A scanned invoice, a merged cell, a decimal in the wrong place. Sample-check the extraction against the originals before anything goes into the ledger.
An estimate with a label is still an estimate. Transparent gap-filling is better than silent gap-filling. It isn’t the same as data, and an assurer will treat it accordingly.
The bottom line
Scope 1 and 2 are the numbers a company controls, which makes them the numbers it has the least excuse to get wrong. The data exists. It’s in the plant room, on the meter and in the invoice pile. The work is getting it from there to the ledger without losing track of what was measured and what was guessed.
That’s been a manual job for as long as I’ve been doing this. It doesn’t have to be.
Five episodes, five places where corporate climate work breaks down. Episode 6 is about what happens when you stop treating them as separate problems.