
Claude for Climate | The complete series
Seven episodes on one argument: corporate climate work is a measurement problem, and AI changes what a small team can measure. This page collects the whole series and every prompt in it, so you can use them without reading 12,000 words first.
How to use this playbook
Each section below is one episode: what it argues, a link to the full piece, and the prompts that go with it. Start with the problem you have this quarter, not with Episode 1.
The prompts are starting points. Attach your own data, supply your own emission factors, and check what comes back. Episodes 1 to 4 described their workflows in prose, so I’ve written those steps out as prompts here. Episodes 5 to 7 are reproduced as published.
Episode 1 of 7
Benchmarking and Boundaries
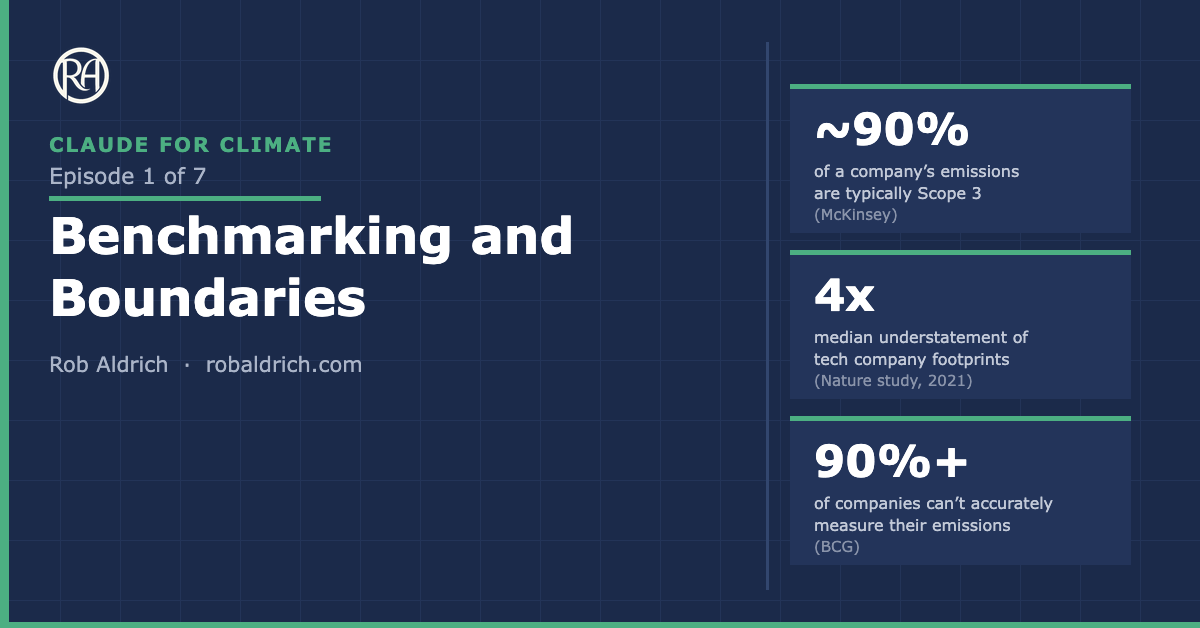
You can’t manage what you haven’t measured. What a real baseline needs, and where most of them fail.
Prompt 1: Organisational boundary
“Here is our legal entity list, our sites and how we control each one. Under the GHG Protocol, compare the equity share, financial control and operational control approaches for us. Show what each includes and excludes, and what you’d need from me to decide.”
Prompt 2: Measured or estimated
“Here is our current emissions inventory. For every line, tell me whether the figure comes from metered data, an invoice, a supplier figure or an estimate. Where you can’t tell, say so. Rank the estimates by their share of the total.”
Prompt 3: A baseline someone else can repeat
“Using this inventory and methodology note, write the baseline procedure as steps someone new could repeat next quarter: data sources, owners, calculations and checks. List every step that currently depends on one person’s memory.”
Episode 2 of 7
The Data Problem Behind Corporate Emissions Reporting
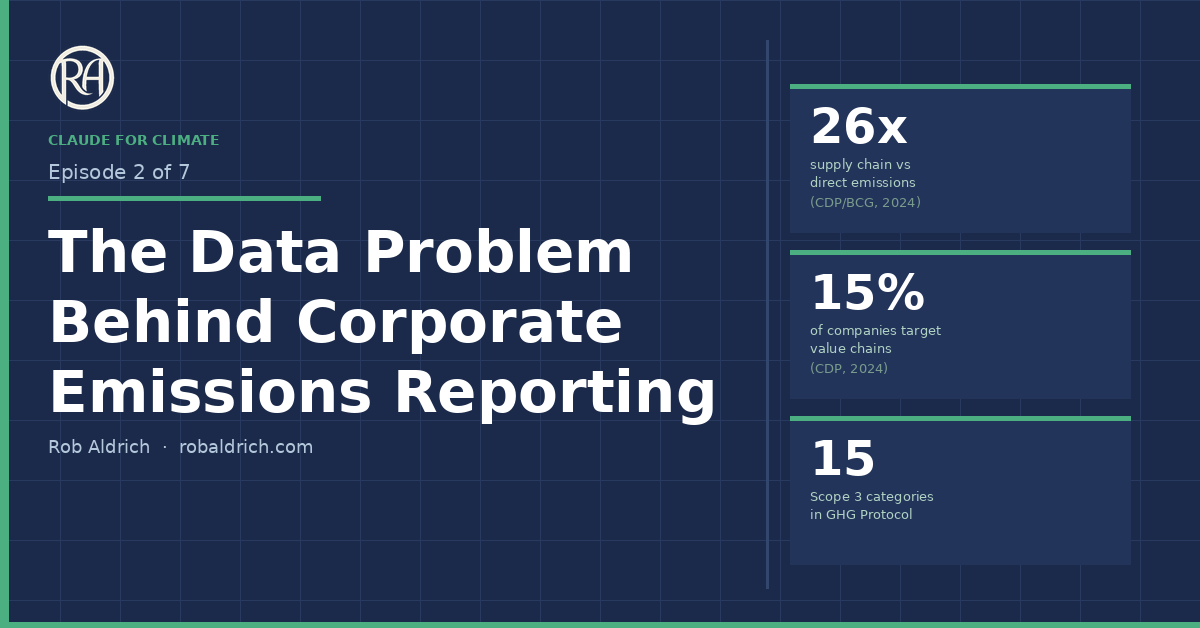
Why Scope 3 data keeps breaking, and a six-step workflow for fixing it.
Prompt 1: Normalise
“These files hold activity and spend data from different systems. Put them into one table with consistent units, periods and category names. Show every conversion you made and list anything you couldn’t map.”
Prompt 2: Reconcile
“Compare this procurement extract with these supplier-reported figures. List where they disagree by more than 10%, the likely reason for each, and what evidence would settle it.”
Prompt 3: Match emission factors
“For each line in this table, propose an emission factor from the factor set I’ve attached. State the factor, its source and year, and how confident the match is. Don’t use factors I haven’t supplied.”
Prompt 4: Gap register
“List every Scope 3 category where we have no data, partial data or spend-based estimates only. For each, estimate its likely share of the total and suggest the cheapest way to improve it.”
Prompt 5: Comparability
“Here is last year’s inventory and this year’s draft. List every change in method, boundary or factor between them. Tell me which year-on-year movements are real and which come from the change in method.”
Prompt 6: Provenance
“Produce the final table with a provenance column for every figure: source file, method, factor, and whether it is measured or estimated. Then write a one-page methodology note an auditor could follow.”
Episode 3 of 7
The Supplier Engagement Problem
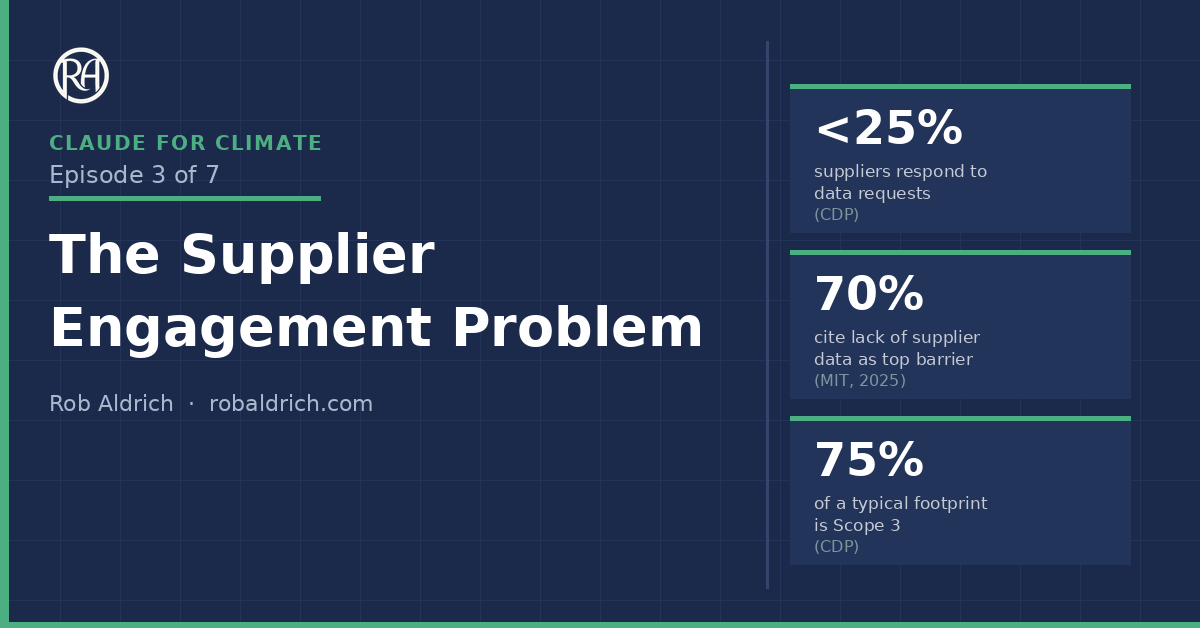
Most of your footprint sits with suppliers who have no reason to share it. How to ask at scale.
Prompt 1: Segment before you send
“Here is our supplier list with annual spend and category. Rank suppliers by estimated emissions, group them into tiers, and tell me which 20% to engage first and why.”
Prompt 2: Requests matched to supplier maturity
“Draft three versions of our emissions data request: one for suppliers who already report publicly, one for those with some data, and one for those starting from nothing. Keep each under 200 words and ask only for what we’ll use.”
Prompt 3: Normalise what comes back
“These are supplier responses in different formats. Extract the reported emissions, boundary, period and method for each. Flag anything that looks inconsistent with the supplier’s size or sector.”
Prompt 4: Chase gaps without burning relationships
“For each supplier whose response is missing or incomplete, draft a short follow-up that names exactly what’s missing, explains why we need it, and offers a simpler alternative if they can’t provide it.”
Prompt 5: Supplier-facing guidance
“Write a two-page plain-language guide for small suppliers on estimating their Scope 1 and 2 emissions from utility bills and fuel receipts. No jargon. Include a worked example.”
Episode 4 of 7
The Two Numbers in Amazon’s Emissions Report
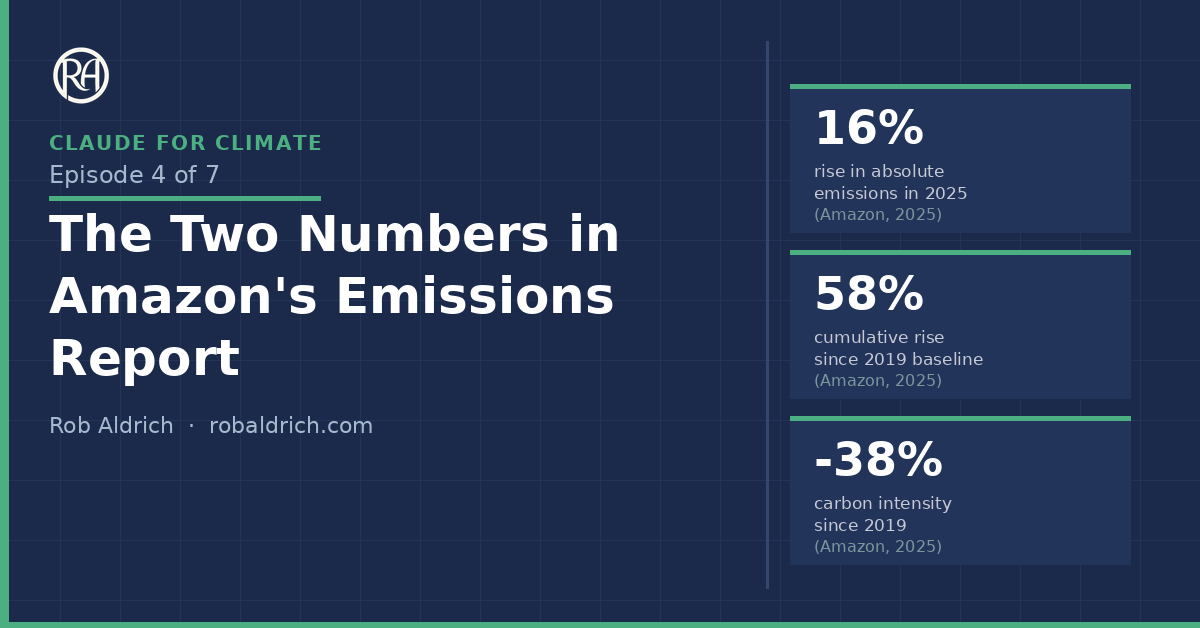
Absolute emissions up, intensity down, same report. How to read a disclosure with both numbers in view.
Prompt 1: Absolute before intensity
“From this sustainability report, extract total absolute emissions by scope for every year disclosed, then the intensity metrics. Show the year-on-year and since-baseline change for each. Put the absolute figures first.”
Prompt 2: What the baseline year is doing
“What baseline year does this report use, and why? Recalculate the headline change against each of the other years disclosed. Tell me how much the choice of baseline changes the story.”
Prompt 3: Procurement claims and physical supply
“List every claim in this report about renewable or carbon-free energy. For each, tell me whether it describes certificates, contracts or physical supply, and whether it’s reported on a location or market basis.”
Prompt 4: Driver against response
“What does the company say is driving its emissions, and what does it say it’s doing in response? Set the two side by side and tell me whether the response is sized to the driver.”
Episode 5 of 7
The Data That Doesn’t Speak IP
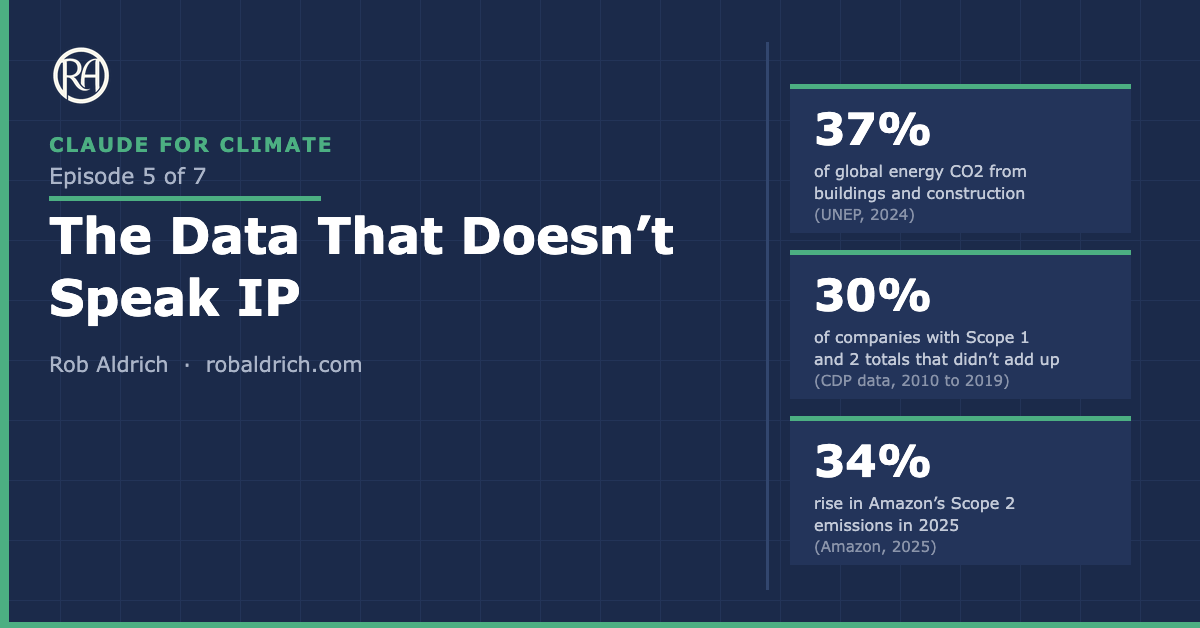
Scope 1 and 2 should be the easy numbers. Getting them from the plant room to the ledger.
Prompt pattern 1: Source inventory
“Here is our site list and every energy document we hold for the reporting year. Build a table by site and energy source showing what evidence we have, the period it covers, and whether it is interval data, an actual-read invoice, an estimated read or a proxy. List the sites and months with no evidence at all.”
Prompt pattern 2: Invoice and export normalisation
“Extract consumption, billing period, units and read type from these invoices and meter exports. Convert everything to kWh or GJ and show each conversion. Flag any bill marked estimated, any period that overlaps another, and any figure you were not certain you read correctly.”
Prompt pattern 3: Gap register
“Using the normalised data, list every gap and outlier by site. For each gap, propose an estimation method, state why you chose it, and label the result as an estimate. Do not fill anything silently. Rank the gaps by their likely effect on the total.”
Prompt pattern 4: Assurance note
“Using these emission factors, which I am supplying with their source and year, calculate Scope 1 and Scope 2 by site. Report location-based and market-based Scope 2 separately. Then draft a methodology note listing, for each line, the source document, read type, conversion and factor used.”
Episode 6 of 7
How Claude Changes the Equation
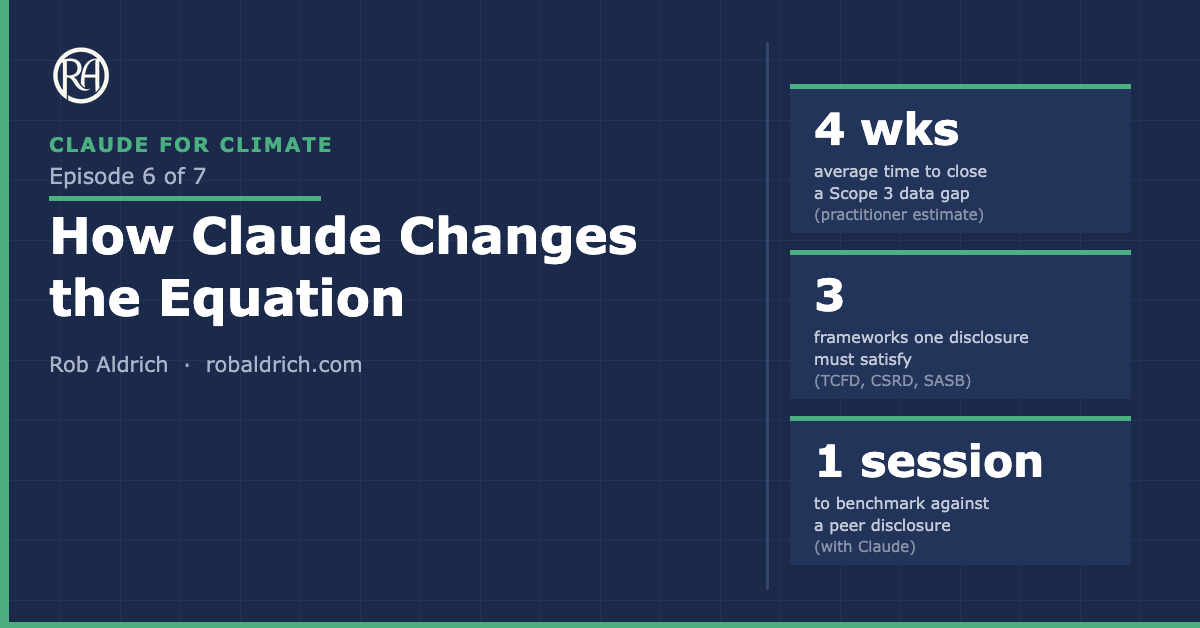
One workflow in place of five point solutions, and what that changes.
Prompt pattern 1: Cross-source reconciliation
“I have Scope 3 Category 1 data from three suppliers in the attached files. They are using different base years and different emissions factor sets. Normalise all three to a 2022 base year using the latest DEFRA factors, produce a comparison table, and flag any figures that look anomalous relative to the others or relative to published industry benchmarks for this category.”
Prompt pattern 2: Disclosure gap assessment
“Here is our draft Scope 1, 2, and 3 disclosure for FY2026. Here is the TCFD implementation guidance and our sector’s latest SASB standard. Identify the gaps between our disclosure and what each framework requires, flag where our language is vague in ways that could create audit exposure, and list the three most material things we should fix before external review.”
Prompt pattern 3: Regulatory horizon scan
“We operate in Australia, the UK, and the EU. Summarise the current status of mandatory climate disclosure requirements in each jurisdiction, the expected timelines, what triggers the obligation for a company of our size, and what we would need to have in place to meet the earliest likely deadline.”
Prompt pattern 4: Board-ready summary
“Here is our complete Scope 1, 2, and 3 dataset for FY2026, our prior year comparisons, and our stated 2030 targets. Write a two-page board summary that: states our current performance against targets, explains the three largest drivers of year-on-year change, identifies our two highest-risk areas for the next reporting cycle, and recommends the one investment that would most improve our data quality.”
Episode 7 of 7
The Leadership Window
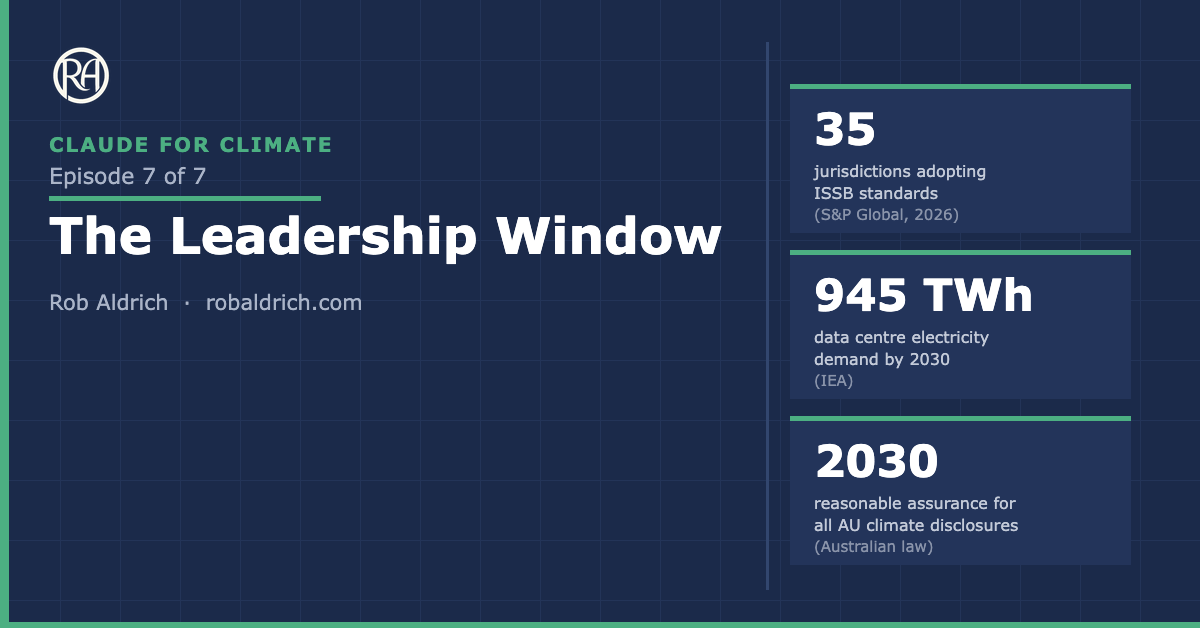
The decisions only leaders can make, and why the window is a reporting calendar.
Prompt pattern 1: Exposure map
“We are an Australian company with [revenue, gross assets, employees] and operations in [jurisdictions]. Based on current rules, which climate disclosure regimes apply to us, from which reporting period, and at what assurance level? Flag anything that is proposed rather than final, and tell me what would change our classification.”
Prompt pattern 2: Assurance readiness test
“Here is our Scope 1 and 2 calculation workbook and methodology note. Act as a reviewer performing reasonable assurance. List the evidence you would request for each material figure, mark which items we can supply today, and rank the gaps by the effort required to close them.”
Prompt pattern 3: Investment case
“Here are our current sustainability team costs, consultant spend and reporting calendar. Build a one-page investment case comparing three options: the status quo, an AI-assisted workflow on our current data, and AI plus metering and supplier data upgrades. State every assumption and show where the answer is most sensitive to them.”
Prompt pattern 4: AI footprint briefing
“Using our cloud provider’s carbon reports and our AI usage data for the last two quarters, estimate the emissions associated with our AI workloads. Explain the method and its uncertainty, and recommend how we should disclose it to the board and in our climate statement.”
The limitations, stated plainly
Every episode has a limitations section. These are the ones that apply to everything above.
Claude doesn’t know this year’s emission factors unless you supply them. Give it the factor set, with source and year, every time.
Claude can misread a document and can state things that aren’t there. Sample-check every extraction against the original before it goes anywhere near a ledger.
Claude can’t verify the data it’s given. It can tell you a figure looks wrong. It can’t tell you the meter was right.
Claude doesn’t create incentives or accountability. It won’t make a supplier respond, install a sub-meter, or make anyone own the number.
Claude doesn’t replace assurance. The point of saving time is to spend more of it checking the work.
Compare notes
I wrote this series as a practitioner, from 25 years of energy and sustainability programs at Cisco, AWS and elsewhere. If you’re doing this work inside a company, or building the tools for it, I’d like to hear what’s holding up and what isn’t. Find me on LinkedIn or get in touch here.
Next: Grounded, a series on AI and the data centres that run it.